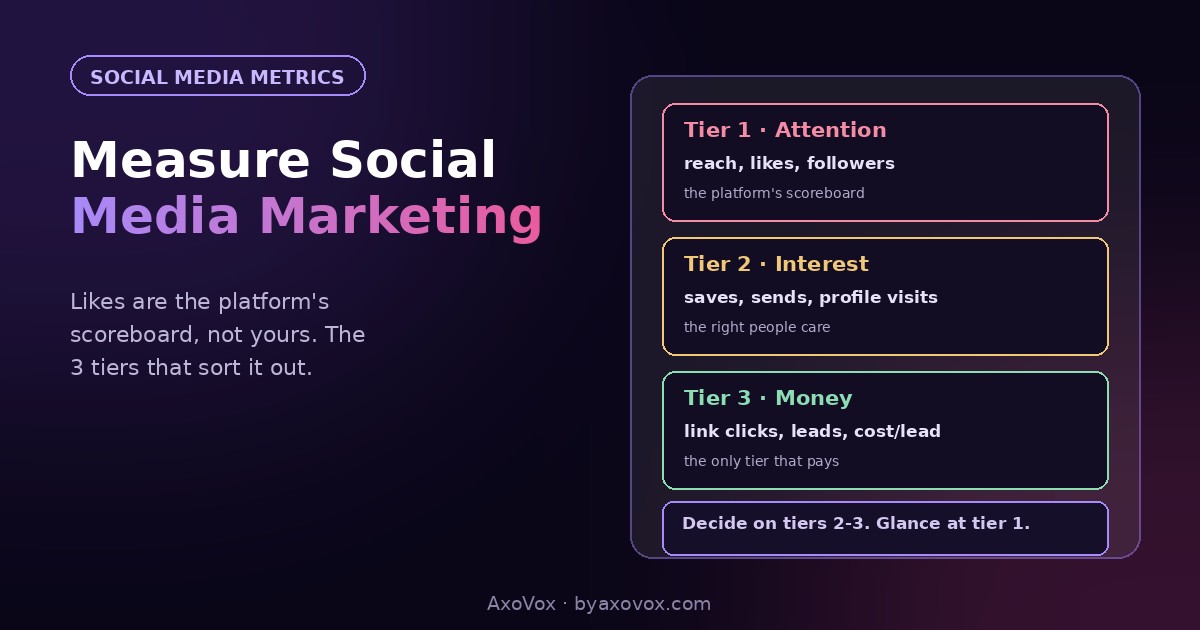
Measuring social media marketing means tracking three tiers of metrics: attention (reach, impressions), interest (saves, sends, profile visits), and money (link clicks, leads, cost per lead). Most businesses only ever look at tier one, which is precisely the tier that can grow forever while revenue stays flat.
Here’s the uncomfortable reason why. Likes, reach and follower counts are the platform’s scoreboard: platforms sell attention, so their dashboards celebrate attention. Your business sells services, so your scoreboard is customers, and the two scoreboards can point in opposite directions for years. A page can double its reach while the phone rings exactly as often. Measuring social properly is mostly the act of ignoring the numbers the app pushes at you and tracking the ones it buries.
The three tiers, and what each one can lie about
| Tier | Metrics | What it tells you | The lie it can tell |
|---|---|---|---|
| 1. Attention | Reach, impressions, views, followers | Whether the algorithm shows you to anyone | “Growth”, while none of it is your market |
| 2. Interest | Saves, sends/shares, comments, profile visits | Whether the right people care | Entertainment interest ≠ buying interest |
| 3. Money | Link clicks, leads, cost per lead, customers | Whether social pays | Only lies if tracking is broken |
Two refinements make tier 2 much sharper than the generic “engagement” everyone reports. Saves and sends beat likes, both as algorithm signals (platforms now weight person-to-person sends heavily) and as intent signals: a like is a twitch, a save means “I’ll need this,” and a send means “someone I know needs this.” And profile visits are the bridge metric: the moment a scroller decides to check who you are is the moment content turned into consideration. A post with 40 likes and 30 profile visits outperformed a post with 400 likes and 3.
The tier-1 trap has a famous shape, and we did the math on it in the going viral breakdown: two million views, thousands of followers, zero booked jobs, because reach without buyer intent is applause. If you remember one sentence from this page: never celebrate a tier-1 number that didn’t move a tier-3 number within a month.
The tracking setup (one hour, once)
Tier 3 doesn’t measure itself, because platforms end their reporting at the click. Four pieces close the gap:
Tagged links. Add UTM parameters to every link you post (Google’s free Campaign URL Builder makes them: set source to facebook/instagram, medium to social). Now your analytics shows exactly which visits and inquiries came from which platform, instead of lumping it into “direct.” If you use the link-in-first-comment approach on Facebook, tag that link too; it’s the one doing the work.
A destination that converts. Send social clicks to a page with one job, the service page or a booking page, not to a homepage that scatters them. What that page does with the click decides tier 3 more than the post did.
The unsexy champion: ask. “How did you hear about us?” on your contact form and in your intake call, logged every time. It’s low-tech, imperfect, and routinely reveals that social drives more (or far fewer) real inquiries than any dashboard suggested, including the invisible kind: people who saw you on Instagram, then googled your name a week later. Dashboards miss that path; the question catches it.
For paid: one number to rule them. If you’re running sponsored posts or ad campaigns, cost per lead is the entire report card. Spend divided by leads, judged against what a customer is worth. Everything else in Ads Manager is commentary.
The monthly review: 15 minutes, 5 numbers
1. Profile visits (per platform), is content creating consideration?
2. Link clicks from tagged links, is consideration leaving the app?
3. Leads that named social (form answers + intake question), the real tier 3
4. Cost per lead, paid only: spend ÷ leads
5. Best post by saves+sends, make more like this one next month
What’s deliberately missing: follower count (a slow vanity thermometer), reach (noise month to month), and per-post like tallies. Five numbers, one direction question each, and decision follows: number 5 tells you what to post more of, numbers 3-4 tell you whether the hours and dollars are earning their place against the alternatives in your customer-source lineup.
The honest benchmark: what “working” looks like
Here’s the calibration most measurement guides dodge. For a typical local service business, organic social’s realistic job is presence, not pipeline: it reassures people who found you elsewhere and keeps you visible to past customers, which is why it ranks where it does in our social media types verdicts. Measured against that job, success looks like steady profile visits, a trickle of “saw you on Facebook” mentions, and content costing few enough hours to sustain. Measured against a revenue-channel job it was never going to do, the same performance reads as failure, and businesses quit a channel that was quietly doing its actual job fine.
Paid social is the opposite: it exists only to produce tier 3, so judge it ruthlessly there. Cost per lead against customer value, within your marketing budget, and no amount of beautiful reach excuses a broken cost per lead.
Frequently asked questions
How do you measure social media marketing performance?
Track three tiers: attention (reach, impressions), interest (saves, sends, profile visits), and money (tagged link clicks, leads, cost per lead). Decisions should run on the interest and money tiers; attention metrics alone can grow indefinitely without producing a customer.
What are vanity metrics in social media?
Numbers that look like progress without predicting revenue: follower counts, likes, raw reach and impressions. They’re the platform’s scoreboard, since platforms sell attention. They’re worth a glance for trend direction and nothing more.
What is a good engagement rate?
Common benchmarks put organic engagement in the low single digits (1-5% of reach depending on platform and size), but composition beats the rate: saves, sends and profile visits signal buying-side interest, while likes alone can inflate the rate without meaning anything. A “worse” rate rich in saves usually outperforms a better one made of likes.
How do I track leads from social media?
Three layers: UTM-tagged links on every post so analytics attributes visits, a converting destination page, and a “how did you hear about us” question on forms and intake calls, which also catches the invisible path of people who saw you socially and searched your name later.
What social media metrics matter for a small business?
Five, monthly: profile visits, tagged link clicks, leads that named social, cost per lead on any paid spend, and the best post by saves plus sends. Follower count and reach are deliberately excluded; they move without money moving.
How do I measure social media ROI?
For paid: leads and customers from campaigns against spend, as cost per lead and cost per customer. For organic: measure against a presence job, steady profile visits and inquiries that mention social, priced in hours. Forcing organic social into a strict revenue-ROI frame usually misjudges what it’s actually contributing.
Want a second pair of eyes on your numbers, or the five-line spreadsheet set up for your business? Send us what you’re tracking now, we’ll tell you honestly which numbers to keep and which to stop watching.